


The role of LNG in the global energy sector and shipping’s role in that market, August 2015
This is the first in a series of three articles on the rapidly developing global LNG market. Every region of the globe will participate as either a supplier or consumer in the LNG market, and substantial amounts of investment are necessary to properly build out the midstream infrastructure, with the most interesting opportunities being in floating liquefaction and regasification.
The changing global energy demand
Global energy demand is projected to grow by approximately 1.4% per annum between 2015 and 2035, which means we will need to produce over 32% more energy on an absolute basis in 2035 than we will in 2015. The fuel source that is best positioned to supply this demand gap is natural gas.
Historically, coal and oil have been the dominant fuel sources in the global energy mix. However, the resulting threats of global warming and the deteriorating health of citizens in heavily industrialised areas have forced a collective re-evaluation of attitudes towards pollution. Attention has necessarily turned to natural gas, as it is the cleanest burning of the fossil fuels. For example, comparing emissions on a per Btu basis, natural gas releases less carbon dioxide and significantly less nitrogen dioxides, sulfur dioxide, particulates, and mercury than both oil and coal. While the cleanest sources of fuel are of course renewable, even with the impressive recent rates of growth, such energy sources will still fall far short of providing enough energy for base loads for many decades. This leaves natural gas as the logical leading fuel source for the future.
The BP Energy Outlook 2035 is projecting that natural gas will overtake oil as the world’s dominant fuel source and will account for almost a third of primary energy by 2035. Coincidentally, the natural gas exploration and production industry has recently gone through a shale production revolution that has opened up existing unconventional gas reservoirs in the United States and around the world. By some measures, we are now capable of producing enough natural gas to power the world’s energy needs for 150 years. The newly accessed, prolific amount of supply to come out of the United States will be the focus of the second installment in this series on global LNG supply and demand.
How natural gas is traded
About two-thirds of the natural gas consumed globally is done so locally. The remaining third is exported to foreign countries. The current geopolitical balance of natural gas trading has the former Soviet Union countries and the Middle East exporting their gas to European and Asia Pacific buyers. Europe is the world’s largest importer of natural gas, and due to the 2011 earthquake and Fukushima disaster, Japan has rapidly increased its consumption of natural gas as it shifts away from nuclear power.
Natural gas can be traded around the world in two ways:
- Transported through existing pipe infrastructure as a gas.
- Super cooled (-160 degrees Celsius) in a liquefaction facility, changing its state to a liquid, and then transported around the world by an LNG carrier.
Gas that has been cooled and gone through a phase change into a liquid is called liquefied natural gas (LNG). Once LNG has been transported to its destination, it must then be returned to a gaseous state at an appropriate regasification facility. Roughly 70% of traded natural gas is exported through pipelines today, with the remaining 30% shipped as LNG. Planned LNG infrastructure projects will likely cause the two trading methods to converge to equivalent volumes over the coming decades, with some even projecting LNG trade to overtake pipeline trade over that period.
LNG market overview
In 2015, LNG global trade is projected to reach as high as 250 million tonnes per annum (MTPA), making it a market worth more than US$120 billion, which, as Goldman Sachs pointed out in a recent note to clients, places the LNG market second only to oil as the most valuable commodity market in the world. As a reference for the strong growth of the LNG market, global energy demand from 2000 to 2015 grew at a Compound Annual Growth Rate (CAGR) of 2.3% and natural gas grew at 2.6% annually. Over that same period, LNG has grown at a significant 6.3% annually. LNG was far and away the fastest growing fossil fuel source over that period. Looking ahead over the next 20 years, LNG is anticipated to grow at a 4.1% CAGR through 2035, significantly faster than the energy market as a whole at 1.4%.
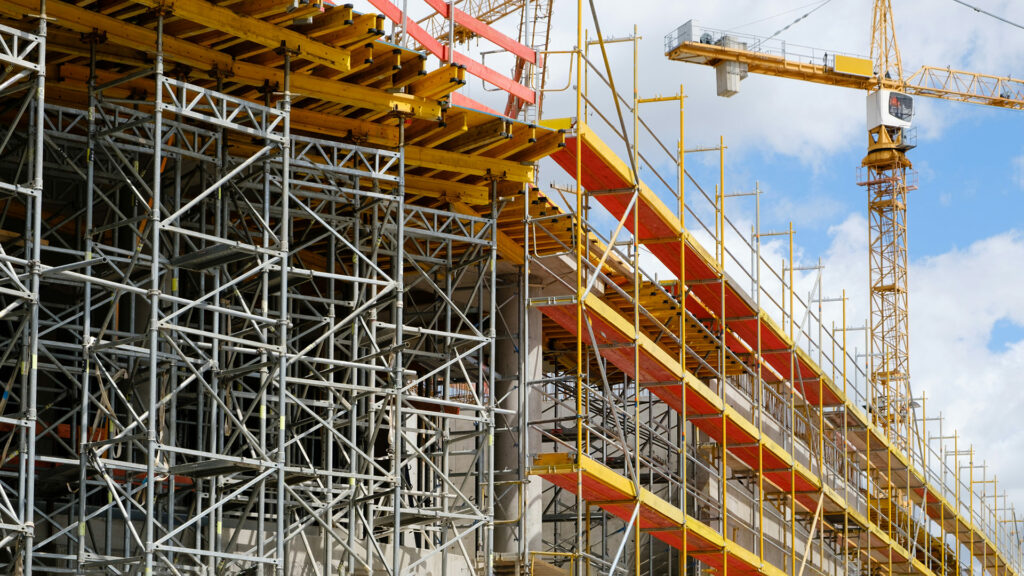
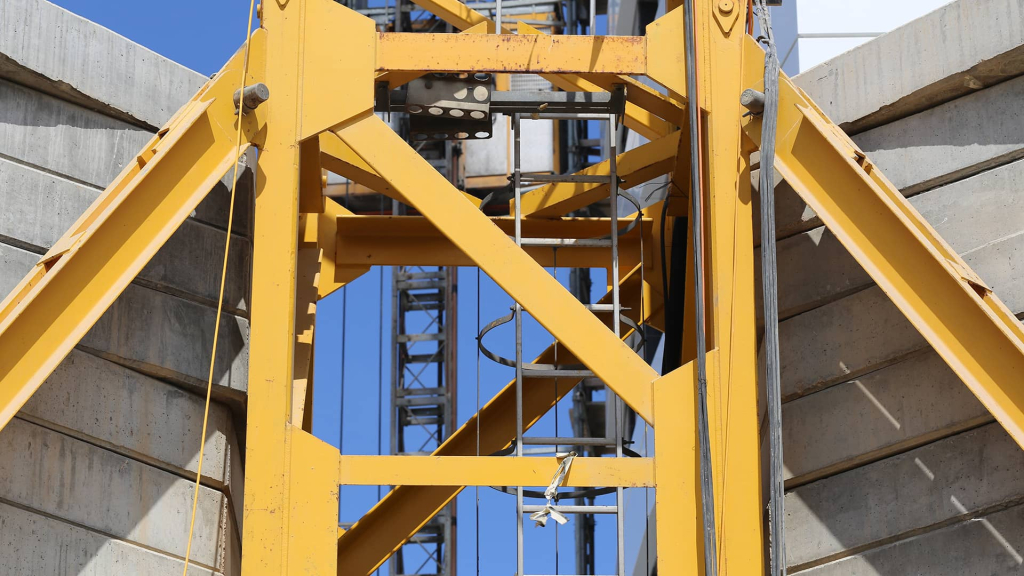
The current LNG market is being limited by supply constraints. There only exists about 300 MTPA of liquefaction capacity globally. The projected 2035 annual traded volume could be as high as 550 MTPA. To meet this projected level of growth, there are currently billions of dollars of planned LNG midstream investment in liquefaction facilities, LNG carriers, and regasification facilities. Of particular interest is the nascent construction of floating liquefaction vehicles (FLNGV). FLNGVs are ships that carry liquefaction facilities. They offer a unique investment opportunity in a capital-intensive part of the midstream value chain and will be the focus of the third installment in this series.
The LNG shipping market
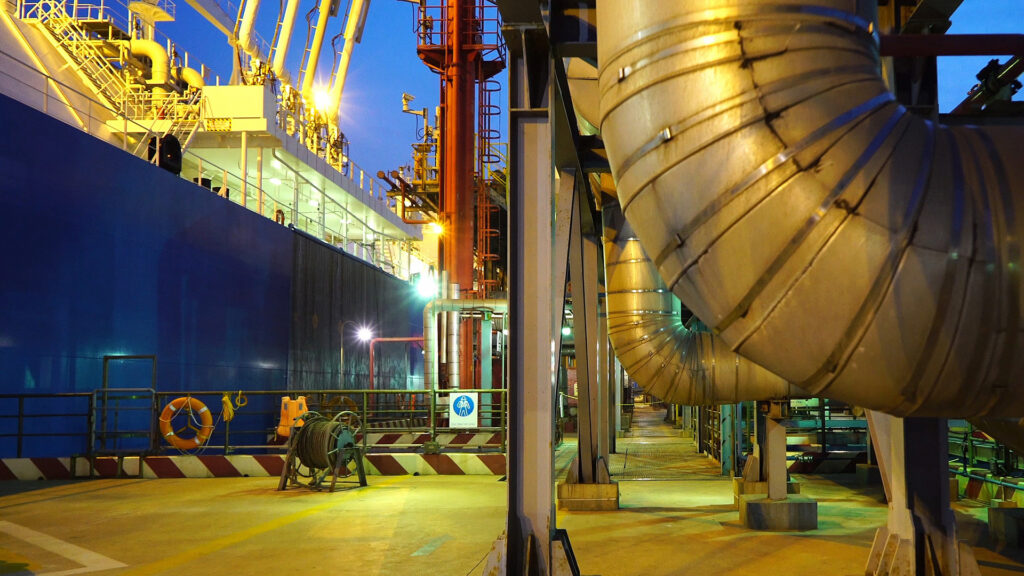
The first LNG trade agreement was between Algeria as supplier and the United Kingdom as buyer in the mid-1960s. There was a steady build of LNG shipping capacity from that point until around 2001, but between 2001 and today there has been a relative explosion in LNG shipping capacity. At the end of 2013, the global LNG fleet stood at 357 vessels, with another 108 conventional carriers already in order books. Along with the conventional LNG carriers (LNGC), we have also seen the construction of several larger Q-Flex and Q-Max sized carriers to transport LNG from Qatar, the largest supplier of LNG, to its buyers.
LNG shipping markets are not without growing pains; supply-demand imbalances can, and do, still occur with relative frequency. As a result, short-term charter rates of LNG ships have been very volatile in recent years. A typical charter rate in the mid-2000s was around US$50,000 per day, which fell to a low of almost US$22,000 per day in 2010 only to spike to a high of over US$150,000 per day in 2012. Rates have since fallen back down closer to historical norms.
In the coming decades, the anticipated growth in global LNG trade as a whole and the resulting scale of investment in midstream infrastructure are staggering. The deals will be between global conglomerates, commodity trading specialists, sovereign nations, and innovative start-ups. Billions will be spent to build land-based and floating liquefaction and regasification infrastructure, as well as billions more to build and update LNG carriers.
The future of trade for the world’s most important fuel source will be on the sea. Our LNG team are noticing the changes in the LNG market and have been increasingly advising clients throughout Asia on the construction of purpose-built vessels and the inherent risks associated with such projects, as well as the sale and purchase of second hand vessels. We have also regularly been instructed to prepare and advise on contracts relating to the utilisation of such vessels.
One current interesting project, which reflects the changing shape of the market, relates to the construction of an LNG terminal in India, the first of its kind in that country. Once completed, this will include a network of pipelines allowing for the sale and supply of gas to a vast number of potential consumers stretching beyond India into the very heavily populated Bangladesh, an enormous market which is almost totally unsupplied.

Download a PDF version of ‘The role of LNG in the global energy sector and shipping’s role in that market, August 2015’
Related Insights

LATEST INSIGHTS